
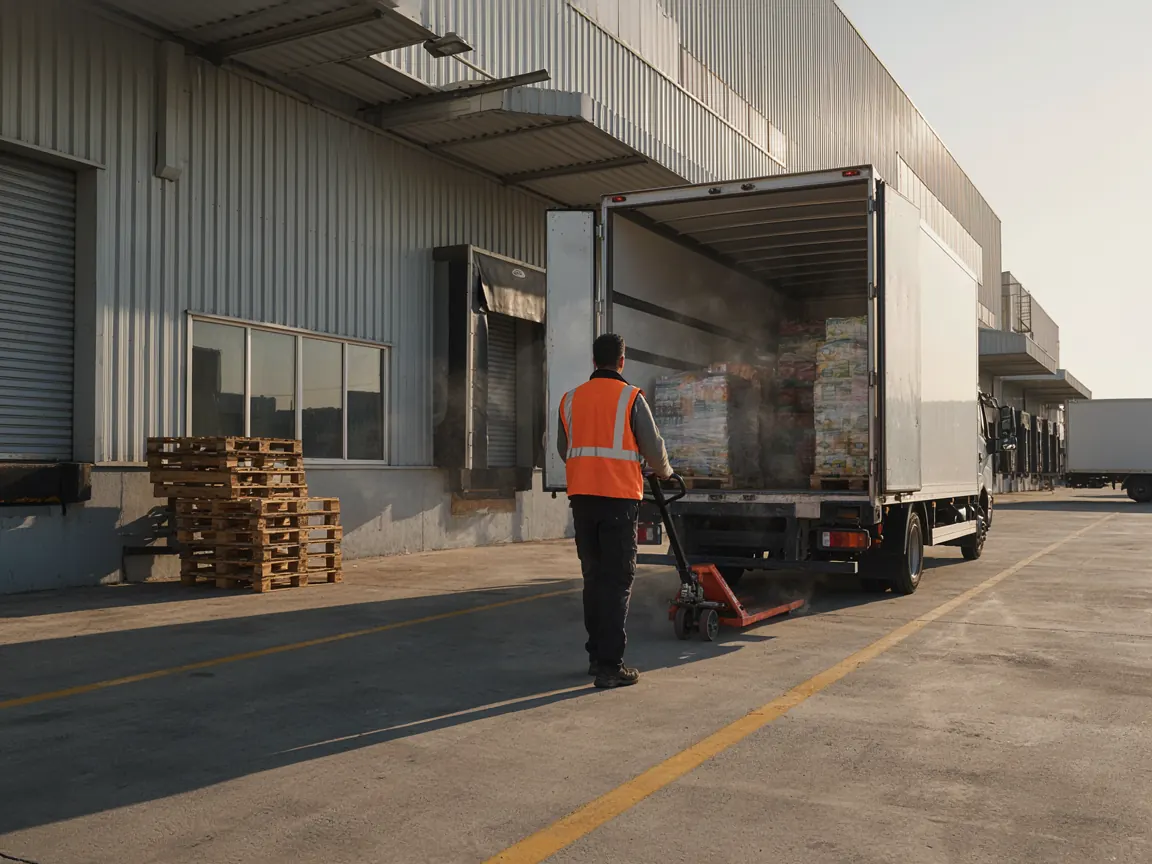
No warehouse is one temperature. In a typical Saudi distribution building the racks under a west-facing roof run several degrees warmer than the centre of the floor by late afternoon, the dock area follows the outside air every time a door opens, and the mezzanine traps the warmest air of all. Humidity behaves just as unevenly, highest near the doors on a humid Jeddah morning and lowest under the air-handling outlets. A warehouse temperature and humidity monitoring system makes those differences visible, records them continuously and alerts the people responsible when a zone drifts outside the range the stored product allows. It is one application of the temperature and humidity monitoring systems HHET installs across the Kingdom; this page covers what is specific to large ambient and controlled-room-temperature spaces.
Why a warehouse is never one temperature
Heat enters a warehouse through the roof, through the doors and with the product. A metal roof in July radiates heat onto the top rack levels for most of the afternoon, and air-handling plant sized for average load catches up only after sunset. Dock doors admit outside air at ambient temperature every time a truck is loaded. Product arriving from an un-cooled truck carries heat into the racks and releases it over hours. Each of these effects is local. A single sensor by the office door, which is where most warehouses keep their one gauge, sees none of them. The result is that a building that appears to be holding 24 °C may have pallets at 30 °C in the top west corner, and the first anyone knows is when a customer rejects a delivery or an auditor asks for mapping data that does not exist.
Temperature mapping: zones, racks and docks
Mapping is the exercise of placing a grid of calibrated loggers through the space, at high, middle and low rack levels, and recording for a period long enough to cover the daily cycle and at least one busy loading period. The result is a picture of where the hot, cold, humid and dry points are. Those points, not convenient wall positions, are where permanent sensors are then fixed. For a pharmaceutical warehouse the mapping study is a documented, repeatable record expected by the Saudi Food and Drug Authority (SFDA); for a food or electronics warehouse it is simply the only way to know the system is watching the right places. HHET carries out mapping with calibrated loggers (the guide to what a data logger is and how to choose one explains the devices used), produces the report and designs the permanent sensor layout from it. See the SFDA temperature monitoring page for how mapping fits the wider record a pharmaceutical distributor keeps.
Seasonal mapping in the Saudi summer
A warehouse mapped in January tells you very little about August. Across much of Saudi Arabia the difference between winter and summer ambient temperature is large enough to move the warmest point of a building and to change how long the plant takes to recover after loading. For that reason HHET recommends that mapping is repeated across seasons, in most cases at least once in the hottest months and once in the coolest, and that the permanent sensor layout is checked against the summer result. Continuous monitoring then fills the gap between studies: because every zone is recorded all year, the platform's trend shows when a zone starts running warmer than it did the previous month, long before a formal re-mapping would find it. Alarm limits can also be set per season where the product allows, so the system is not generating nuisance alerts in July for a drift that is within specification.
Humidity: packaging, electronics and pharma
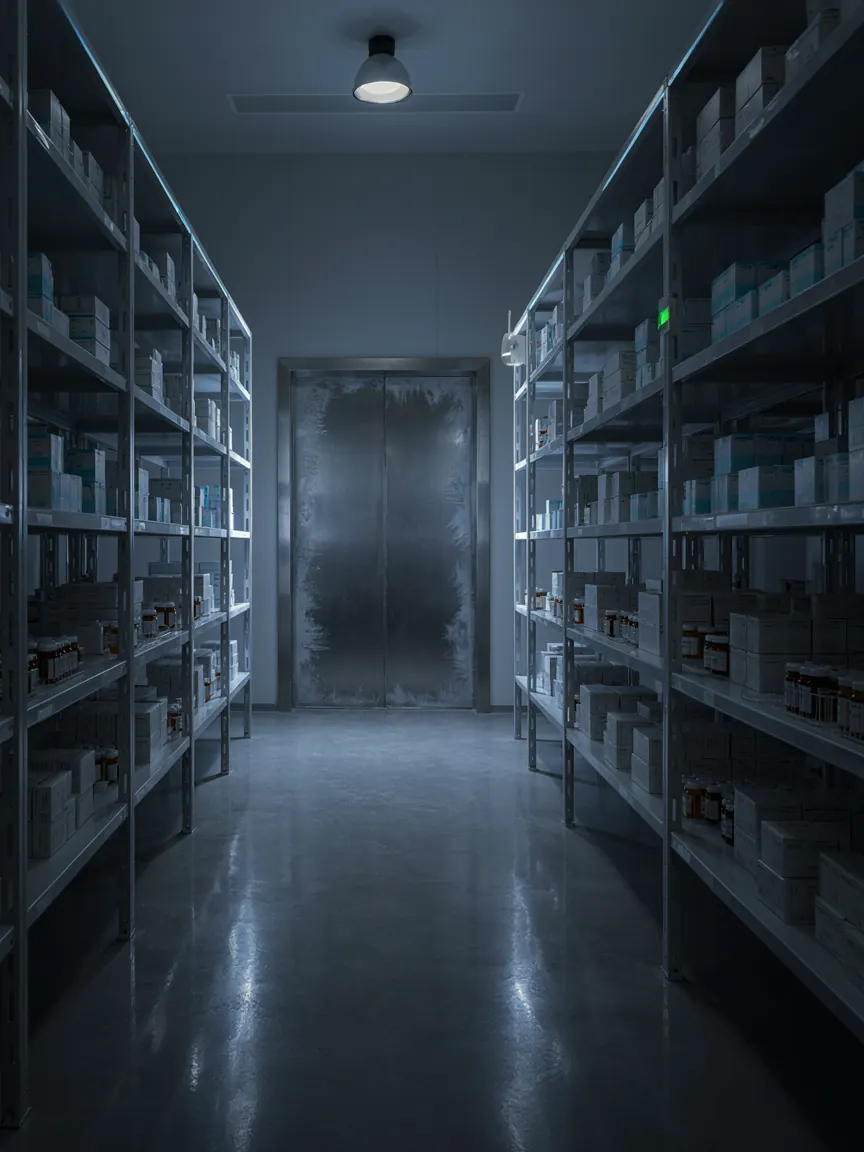
Humidity monitoring matters in three kinds of warehouse. Packaging and paper goods absorb moisture, lose strength and stack poorly; cartons that have sat near a humid dock are the ones that collapse at the top of a pallet. Electronics and components are sensitive to high humidity, which encourages corrosion and condensation when product moves between temperatures, and to very low humidity, which raises static risk. Pharmaceutical products commonly carry a relative humidity limit on the label alongside temperature, and SFDA expectations for controlled storage include humidity records. In every case the sensor is a combined temperature and humidity unit, so the same monitoring point serves both. On coastal sites such as Jeddah, Yanbu and Dammam, humidity near the doors can swing sharply between morning and afternoon, and the record shows how far inside the building that swing reaches.
Zones and sensor density
There is no fixed rule for how many sensors a warehouse needs. The right number comes from the mapping study, the sensitivity of the product and the regulator's expectations. The table gives the approach HHET typically takes, as a starting point for discussion rather than a specification.
| Zone | What matters | Typical approach to sensor placement |
|---|---|---|
| Ambient racking, centre of floor | Uniformity over time | One monitoring point per mapped sub-zone, at high and low rack level where the mapping showed a vertical difference |
| Racking under the roof or on sun-facing walls | Afternoon heat gain | Additional points at the top level where the mapping showed the warmest readings |
| Loading docks and staging | Door-driven swings in temperature and humidity; dwell time | A point near each dock group, plus door contacts on dock doors where dwell matters |
| Mezzanine and high-level storage | Trapped warm air | At least one point per mezzanine area, mounted high |
| Controlled-room-temperature pharma zone | Compliance with the label range; records | Density set by the mapping study and your quality system; calibrated sensors with certificates |
| Cold rooms within the warehouse | Continuous low temperature; door events | Covered on the cold room page; monitored on the same platform |
Reporting: from continuous data to a usable review
Continuous monitoring produces a great deal of data; the value is in what it is turned into. The HHET platform produces three kinds of output for a warehouse. Live views and alerts for the floor, so the shift supervisor knows when the dock zone has drifted. A daily or weekly summary per zone with minimum, maximum, mean and any excursions, for the quality or operations manager. And an audit export, a complete record for a date range with the calibration status of every sensor, for inspectors and customers. Reports are scheduled to email or pulled when needed, and exported as PDF or spreadsheet. The monthly review is where the system pays for itself: the zone that is creeping upward, the dock that is open too long, the plant that recovers more slowly than it did in spring.
Give the dock zone its own alarm rule. It will swing more than any other part of the building, and a limit copied from the racking will either alarm constantly or be switched off. A longer delay and a wider band at the dock, with a strict rule on dwell time for staged product, is the usual answer.
Sensors, cold rooms and getting a quote
The sensors themselves are described on the temperature and humidity sensors page, including wireless and wired types, accuracy and calibration. Chilled and frozen rooms within the building are covered under cold room temperature monitoring and are monitored on the same platform. Price is driven by floor area and the number of mapped zones, whether a mapping study and documentation are required, sensor type and calibration certificates, and the alerting and reporting you need. To scope a warehouse temperature and humidity monitoring system, request a quote and tell us the building size, what you store and whether you work under SFDA or HACCP expectations.
Large buildings usually need many sensors without wiring. The IoT wireless monitoring page explains the sensor networks that make that practical.
Last reviewed .